Introduction to reading a graph (primary)
Easy introduction on how to read and interpret a graph
Collaborative Creating Of A graph
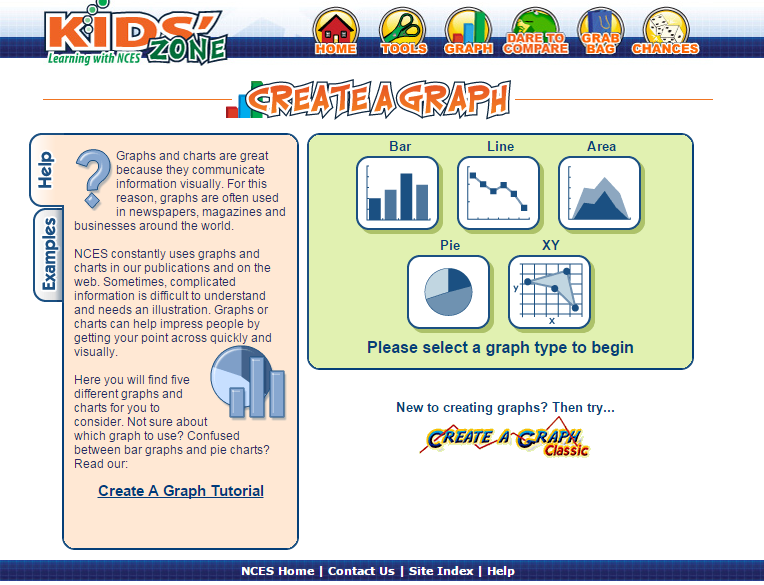
This site allows students to create graphs using data they collect or make up. They can then print or send their graph via email.
Working with bar graphs
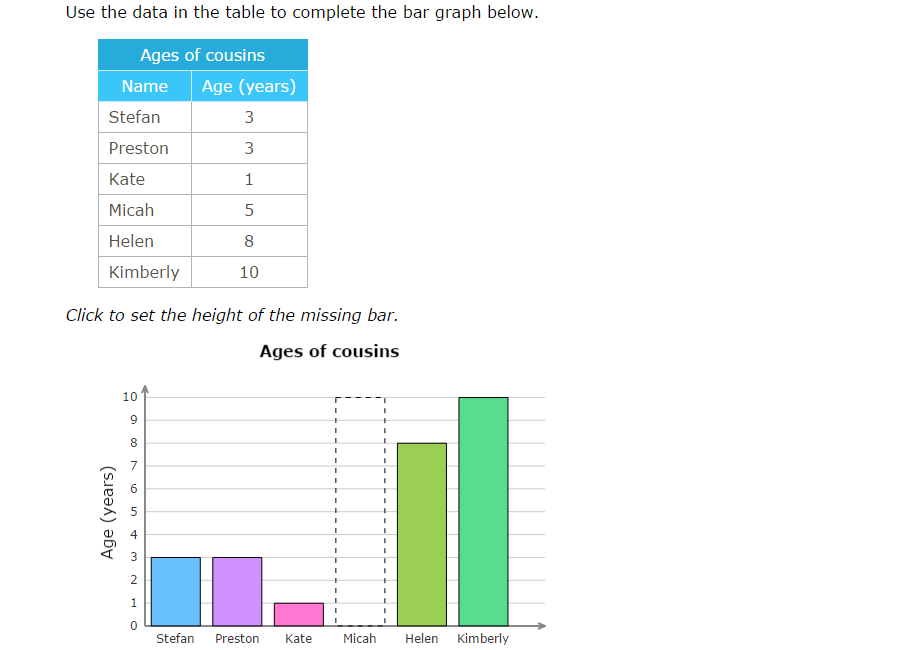
Create bar graphs, Grade 3+
|
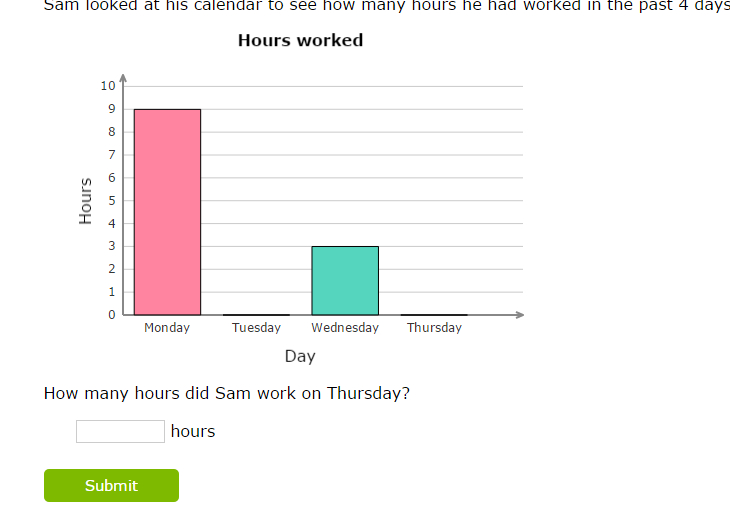
Interpreting bar graphs, Grade 3+
|
Working with Pictographs
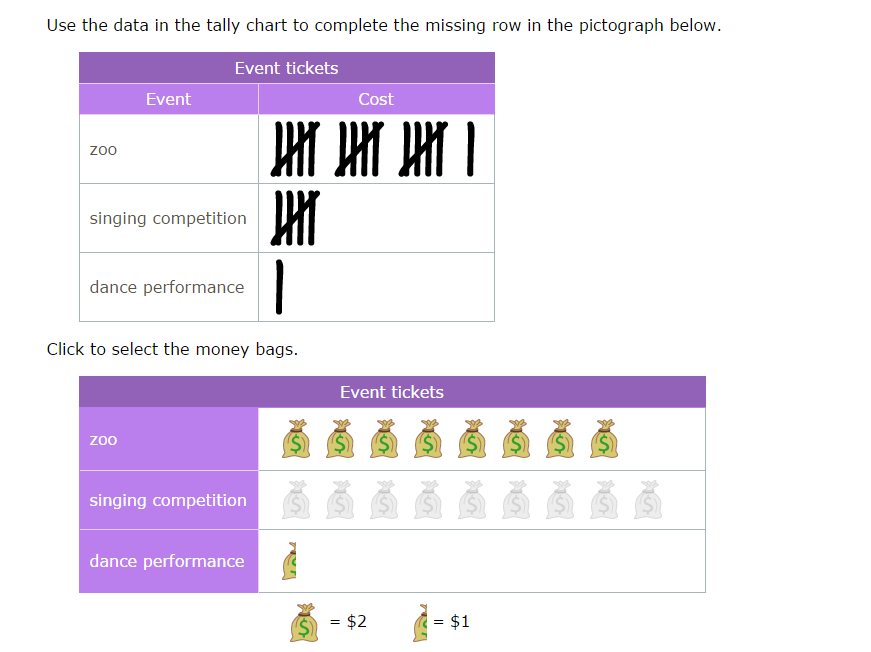
Creating pictographs, Grade 3+
|
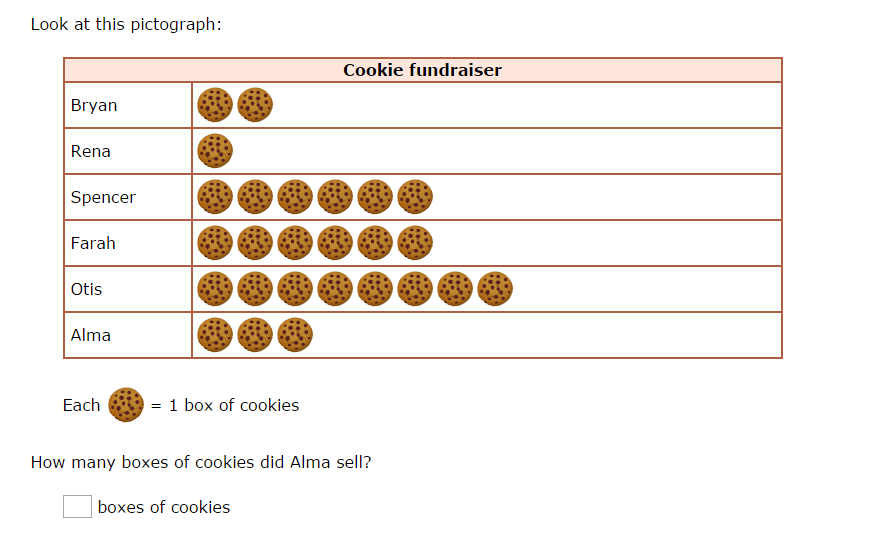
Interpreting pictographs, Grade 3+
|
Timelines
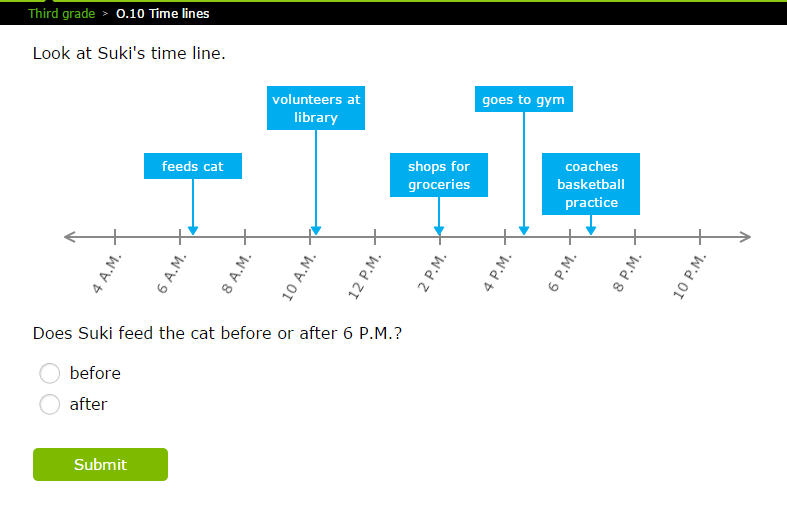
How to read a timeline, Grade 3+
|

Students will need to zoom in to read the information, but could create a worksheet and have students fill in the years and information from the picture
|
